Endpoint Analysis Tool - User Interface
In this section:
•Differences: Tool and Console Interface
The Environment Analysis Tool provides a user interface to view and analyze .etl files for a specific policy configuration. This section describes the landing page, its component panels, and common display conventions the interface uses.

| Label | Panel |
Description |
|---|---|---|
| a | Node Tree |
Node Tree structure is taken from configuration |
| b | Actions Panel |
Shows actions and conditions for the node currently selected in the Node Tree |
| c | Details Panel
|
Shows details for item currently selected in the Node Tree or Actions panel |
| d | Loaded Files, Session Filter, Execution Inspector |
|
Details panel
The Details panel (lower left) displays information for the item selected. Note that items may be selected in either the left or right pane.
Example:
Loaded Files
The Loaded Files panel is in the tabbed area (lower right). It lists the configuration file and event logs currently loaded: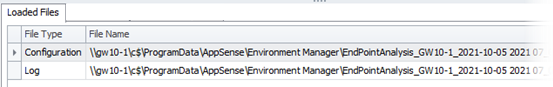
Event log files can be removed:
•In the Endpoint Analysis Tool menu select File > Clear Logs
Note; this action will remove all logs. It is not possible currently to remove specific logs.
Session Filter
The Session Filter panel is in the tabbed area (lower right). It shows the session information for each event. 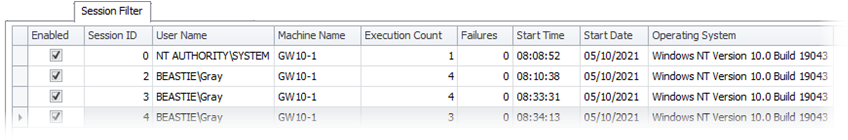
Customize View (DevExpress Controls)
The Session Filter view comprises a Developer Express grid. The view can be customized using the context menu. Users can add or remove columns and re-order, sort or group them for example.
To customize the view:
•Right-click on the column header to display the context menu then select the option required.
•Additional columns are available and these can be selected using the Column Chooser option.
•To reset default settings select the View menu > Session Filter > Restore settings
Settings changes made in this view are saved in the current user profile and restored the next time the program is run.
Execution Inspector
The Execution Inspector panel is in the tabbed area (lower right). It lists all execution events read from the event logs and displays full details.
As with the Session Filter, the Execution Inspector comprises a Developer Express grid which allows users to customize the view and retain their changes. Refer to Customize View (DevExpress Controls) above.
The Endpoint Analysis Tool will highlight an endpoint execution item in the Node Tree or Actions panel for a selected trigger, node, action, or condition:
•In the Execution Inspector select the row for the trigger, node, action, or condition required.
•Double-click, press Enter, or right-click and select Show in Action Tree from the context menu.
•Details of the event execution are highlighted in the Node Tree or Actions panel.
View Menu
The View menu enables you to modify the display of data within the Endpoint Analysis Tool. This can be valuable when navigating large configurations for example.
View menu options include the following:
Node / Action Tree
•Expand All - expands all collapsed items in the Actions panel on the right.
This option has no effect if the Actions panel is empty.
•Collapse All - collapses all items in the Action panel, showing only the top-level ones.
This option has no effect if the Actions panel is empty.
•Show Nodes that did not run - this option enables you to show or hide nodes that did not execute. By default the option is selected. To hide nodes that did not run, clear the check box.
The option can be useful when viewing large configurations and where only a small part is relevant to your analysis.
•Show Actions that did not run - this option enables you to show or hide actions and conditions that did not execute. By default the option is selected. To hide actions that did not run, clear the check box.
Note that a condition that ran but returned a False value is displayed, its dependent actions are hidden.
Session Filter
•Enable/disable all sessions - Enables or disables all sessions currently loaded.
•Restore session filter settings - removes customization of columns in the Session Filter and restores the factory defaults.
Execution Inspector
•Restore execution inspector settings - removes customization of columns in the Execution Inspector and restores the default settings values.
•Only show node executions - this option enables you to show or hide execution records applicable only to the node selected. By default the option is cleared.
Note, actions executed as part of a reusable node reference are not shown. To view actions and conditions for a reusable node, select the reusable node itself.
Differences: Tool and Console Interface
There are some important differences to be aware of when viewing a policy configuration file using the Endpoint Analysis Tool when compared with the Environment Manager console itself:
Navigate to Reusable Nodes
In the Endpoint Analysis Tool, it is possible to navigate to reusable nodes from their references:
1.In the Node Tree, select the node required and right-click the reusable node reference.
2.Select the context menu option required.
Italic Text for Nodes and Actions
Nodes and actions that have not yet been executed are displayed using italic text.
Note that when a configuration is initially opened in the tool no log file will have been loaded so all nodes and actions are italicized.
When an event log is loaded, nodes that have been executed on the endpoint(s) are changed from italic to a normal font.
Actions
Certain actions that are not normally visible in the console are displayed within the Endpoint Analysis Tool.
For example, Undo actions for drive mappings are added to the user logoff trigger:
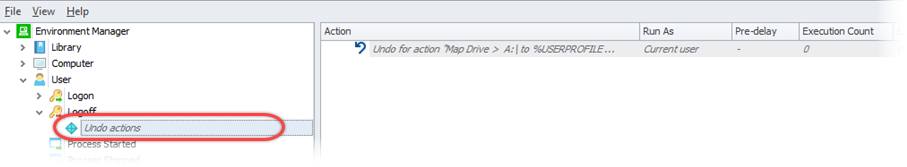
When the advanced setting Undo Action Sequencing is enabled (see Advanced Settings: Undo Action Sequencing), a reusable node is automatically created . It contains the sub-nodes that are to be executed at logoff and is highlighted with an asterisk (*) to show it created automatically. This reusable node is then used within the logoff trigger alongside actions that are to be reverted. A node tree on the logoff trigger is automatically generated to reflect this.
Note that it is not possible to view or edit details of a specific action.
Scheduled Nodes
A scheduled node is represented twice:
•Displayed in its original position within the configuration, with a Register task action associated with it: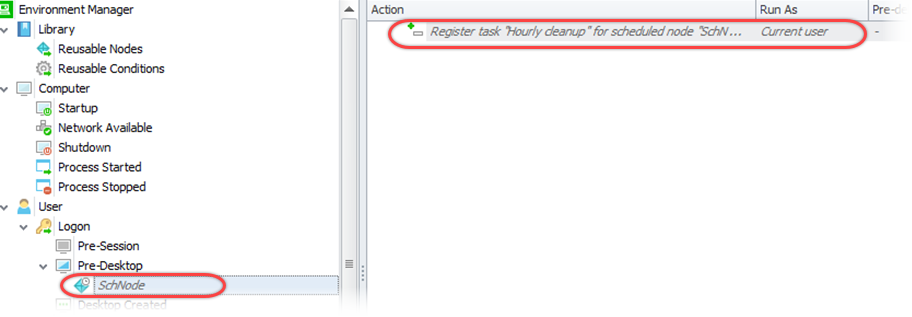
•Displayed in the ScheduledNodes trigger -where it is listed with its scheduled task name Hourly cleanup: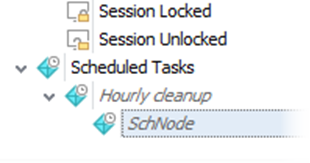
Related Topics:
Endpoint Analysis Tool - Load Logs